Measuring Mar Performance by Proportional Visibility
March 22nd, 2019Introduction
As part of our service work we are often presented with difficult methodological and analytical problems and we are tasked with developing new methods to analyze the systems presented. Because our customers tend to be outcomes-based (typically for aesthetic concerns), we are able to develop more or less ad hoc procedures - based on existing science and protocols - that match the practical concerns of their products requirements. The SMS Scratch G5.5 Machine is designed for fundamental research and characterization of scratch and mar damage but is also capable of performing these practical comparative tests between systems. The goal for most assessments is to determine if there is a statistically relevant difference between the provided systems, and if so, to rank them according to performance.Although a lot of older methodology persists, modern and reliable macro-scratch and characterization methods are well-defined and studied. Definitions for mar and scuff are less well-defined and tend to fall into a few major classes: mar-darkening, mark-lightening, multi-asperity roughening, scuffing, and a few other more or less industry-standard physical phenomena. Simple, single-valued outcomes measures for these differing mar types have been elusive. To date, the best metric defined has been "contrast curve" assessment. The basic procedure is as follows:
- A linearly progressive increasing load is applied at 10 to 100 mm/s from a mar stylus onto the test system, starting from 1 N of load and increasing to 3 or 30 or 100 N of load, depending on the material type. The mar stylus might be single large asperity (7mm, 10mm), or a barrel or cylinder type (6mm or 12mm), or an abrasive type (7x7mm).
- The mar is then scanned, photographed, or otherwise imaged using human-visible light spectra, and a curve consisting of the contrast different between the objective (foreground) mar damage are and the virgin (background) sample are compared and rendered.
- It is very sensitive to variance in the background region
- The curves must be normalized for actual applied load ranges and strain rate
- It is susceptible to small variations in pitch, yaw, and rotation leading to different specular profiles during imaging
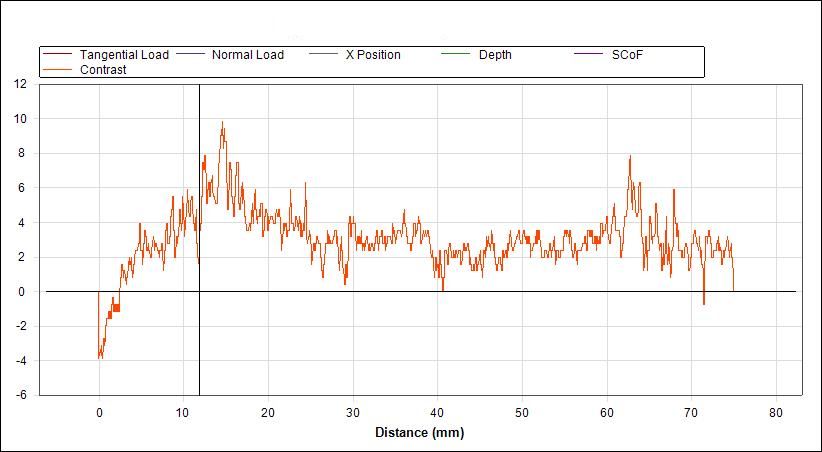 We expect to see a progressively increasing contrast curve. Instead, excess free parameters dominate the curve.
A client presented us with the exterior plastic of a product, with a specific need: reduce damage during manufacturing and shipping. The primary modes were product to product contact, and product to shipping container contact. In our first attempt, the products provided were non-homogenous off-white shades and semi-translucent. We used the prescribed high-asperity (2400 grit sandpaper, 7x7mm, mounted via foam-backed tape) styli and the contrast curve quantitative assessment technique. The results were unsatisfactory, and could not discriminate between the systems. This despite the fact that there was good evidence from human panels that there was a distinct performance difference between the two systems.
For material assessment of fundamental system properties, the recommended molding characteristics we recommend are as follows:
- Systems should be matte black or semi-gloss. This reduces the complexity of the imaging problem.
- Materials should be flat, parallel, and uniform in production. Because the load is derived parameter of the testing mechanism, uniformity of the system is key to good tests and good data.
- Materials should be free of extraneous visual information, like fingerprints, markings, dust, dirt, or striations or other visible marks from casting or production processes.
Analytical Method
We had made several observations of the method and analytical issues surrounding practical mar testing and had formulated a plan for addressing both. With the customer's permissions, we modified the methodological and analytical process. The key insights we had were as follows:- The sandpaper was far too aggressive, resulting extremely early onset of visible phenomena. Useful data could not be reliably acquired.
- The contrast curve method exacerbated phenomenological and individual test variances (start and end load, minor changes in strain rate). The analytical method was super-proportional to variance within individual tests.
- The foam-backed tape was a cause of a lot of mechanical failures due to mis-alignment and failure-to-contact during tests.
- Visible proportion is coarsely proportional to progressive load. Because it is a broad mean over the entire object area, much of the localized specular and color defects are minimized for analytical purposes.
- Reduces or eliminates the need for curve normalization - small variances in start and end load and curve profile are relatively small compared to visible proportion variance due to inherent material variability.
- Styli material is mounted rigidly via non-deformable double-sided adhesive. This allows the machine pressure to align the tip flat and parallel with the test specimen.
- Significantly less aggressive styli materials. The styli materials chosen were non-recycled kraft paper (cardboard) and 7x7mm cuttings of the product itself, mounted to a 7x7mm stainless steel mar tip. These two materials were significantly less aggressive than any of the sand paper materials. This allowed us to run significantly steeper and higher load profiles (60N and 100N) compared to sandpaper, which often showed overwhelming damage as low as 3 to 5N of load. In general, inter-system and inter-test variance is inversely proportional with load range.
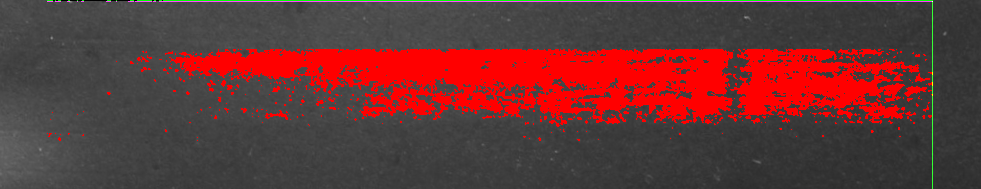
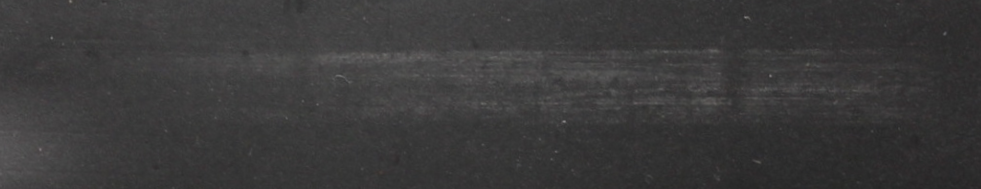 Raw imaging vs contrast area analyzed mar regions.
Results
The efficacy of the test and analytical methods were immediately apparent. A small panel of human observers was first used to produce an a priori assessment of the test panels to level-set quantitative performance. Quantitative assessments showed clear discriminatory power and statistically relevant variance between the two systems, with acceptable variance between repeated tests within each system. The quantitative assessment matched the human observation.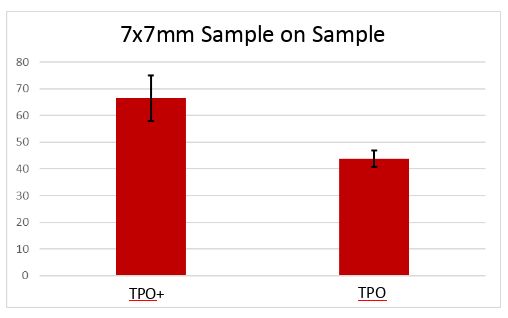
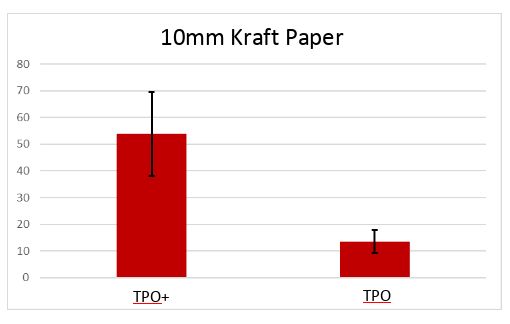 Results show clear discriminatory power for both styli modes.
Conclusion
The proposed method is more flexible and more closely matches the damage modes experienced for practical applications of materials within common industrial settings. The methods are derivative of existing methods and are are really the application of carefully chosen parameters within the context of existing mar assessment protocols.The analytical method is grounded within the existing quantitative methods for both mar and scratch (leveraging relative contrast), but produce a single value that is resilient to inter-test and materials variances and is much more easily comparable. The test proved resilient to small changes in color and gloss within the systems. Tests results were internally consistent within the same material, and showed clear discriminatory power between discrete systems that were suspected of having known performance differences.
The customer was able to show analytically that their improved system had quantitatively comparable and significant results. This resulted in quantitative performance assessments that they could use in their product line and were used in developing a patent for their additive technology. Surface Machine Systems was happy to have helped in their performance improvement process.
For non-textured, dark-colored, matte or semi-gloss materials, Surface Machine Systems endorses this methodology for comparative assessment of mar. This method is being validated and refined by the Texas A&M University PTC SCRATCH Consortium Lab and is currently available in our Tribometrics analytical software package.